Consumer360 – Customer Segmentation & Churn Analysis
An end-to-end retail analytics solution that analyzes customer behavior, segments customers using RFM analysis, and identifies churn risks through an integrated pipeline of SQL, Python, and Power BI.
🎥 Video Walkthrough
Video Coming Soon
The detailed video walkthrough for this project is currently in production.
📌 Problem Statement
Retail businesses often lack visibility into customer behavior, making it difficult to identify high-value customers and detect early signs of churn.
Key challenges include:
- Inability to identify profitable customer segments
- Lack of insights into customer engagement and retention
- Difficulty in designing targeted marketing strategies
- Absence of a unified Customer 360° analytical view
This project addresses: How can businesses segment customers effectively and proactively reduce churn using data-driven insights?
⚙️ Approach & Methodology
- Extracted and cleaned retail data using SQL
- Performed data aggregation and transformation for analysis
- Conducted RFM (Recency, Frequency, Monetary) analysis using Python
- Calculated Customer Lifetime Value (CLV) for segment evaluation
- Segmented customers into: Champions, Loyal Customers, At Risk, Low Engagement
- Built automated ETL pipeline for data processing and refresh
- Developed interactive Power BI dashboards for business insights
🧠 Concepts & Skills Applied
📊 Key Insights
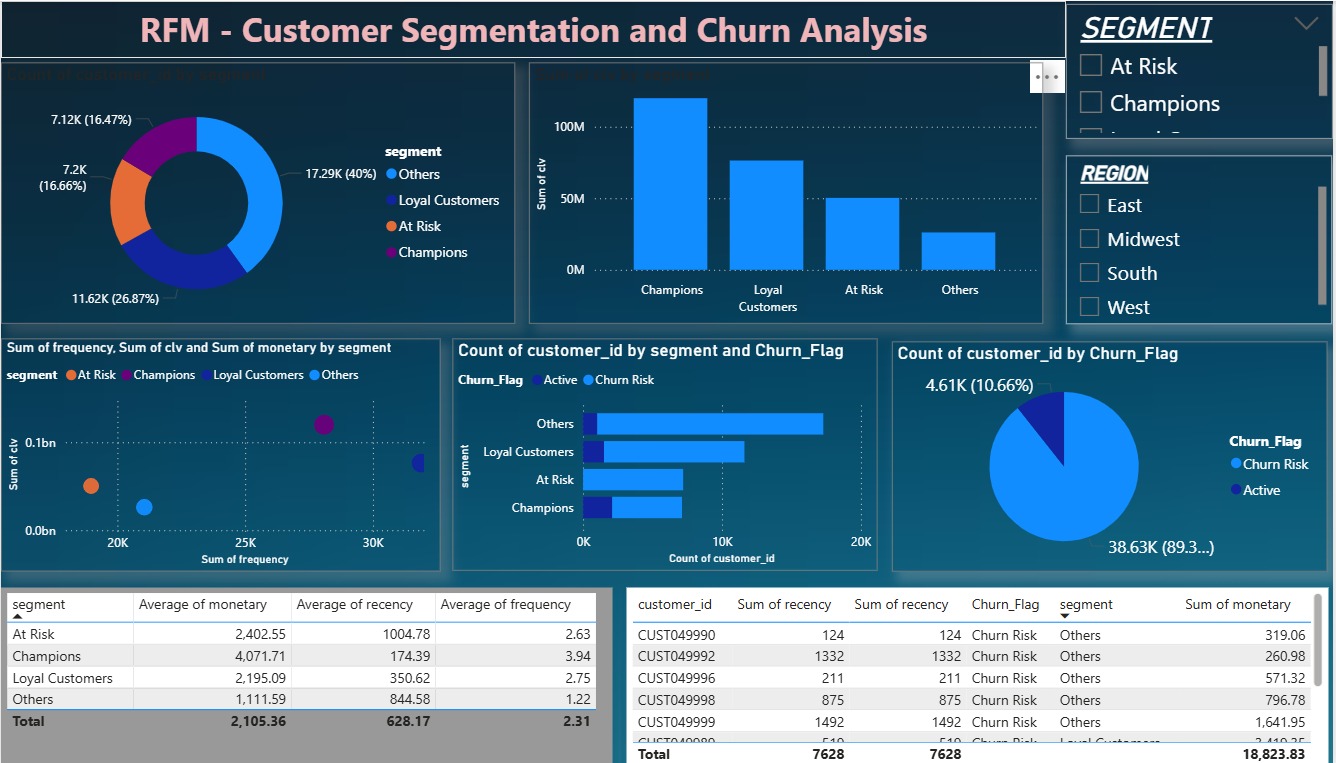
- Champion customers contribute the highest revenue and CLV
- At-Risk customers show declining engagement and higher recency values
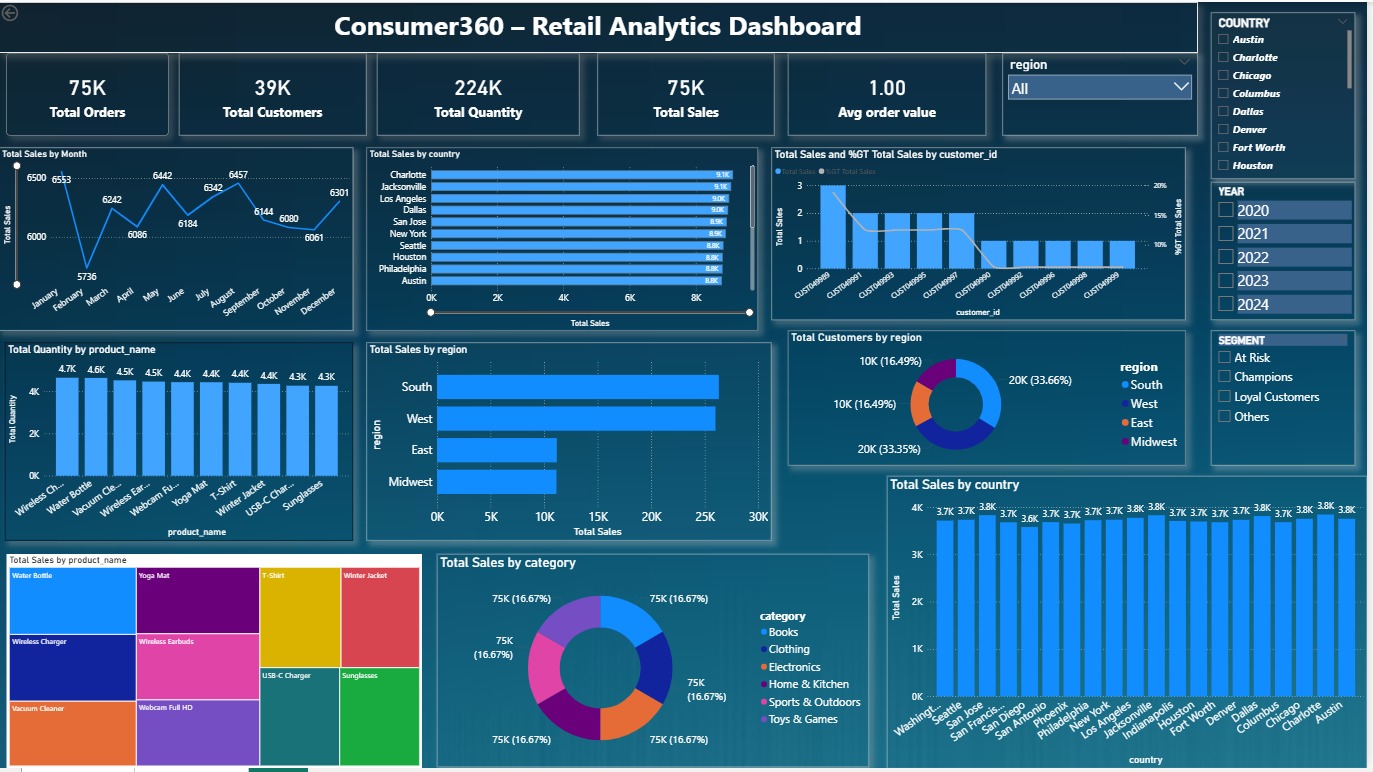
- West and South regions generate the highest sales
- Electronics and Clothing dominate total revenue contribution
- A small percentage of customers contribute a large portion of revenue (Pareto Principle)
- Loyal customers provide stable and recurring revenue
- Low-engagement customers indicate untapped growth opportunities
📈 Dashboard Highlights
⭐ Retail Performance Dashboard
- Total Sales, Orders, Customers, Quantity
- Monthly Sales Trends
- Sales by Region & Country
- Product & Category Performance
⭐ Customer Segmentation Dashboard
- RFM-based customer segmentation
- CLV analysis
- Churn Risk vs Active Customers
- Segment-wise contribution and behavior
💼 Business Recommendations & Impact
- Launch targeted retention campaigns for At-Risk customers
- Introduce loyalty programs for Champions and Loyal segments
- Increase marketing investment in high-performing regions
- Promote high-performing product categories strategically
- Implement personalized product recommendations
- Monitor churn-risk segments proactively
Expected Impact:
• Improved customer retention and reduced churn
• Increased revenue through targeted marketing
• Better customer segmentation and engagement strategies
• Enhanced decision-making using Customer 360° insights
⚡ Advanced Features
- RFM-based segmentation for customer classification
- Customer Lifetime Value (CLV) calculation
- Automated ETL pipeline using Python & Task Scheduler
- Multi-tool integration (SQL + Python + Power BI)
- Real-world retail analytics workflow simulation
- Dynamic Power BI dashboards for business decision-making