Finance Market Risk & Volatility Analysis Dashboard
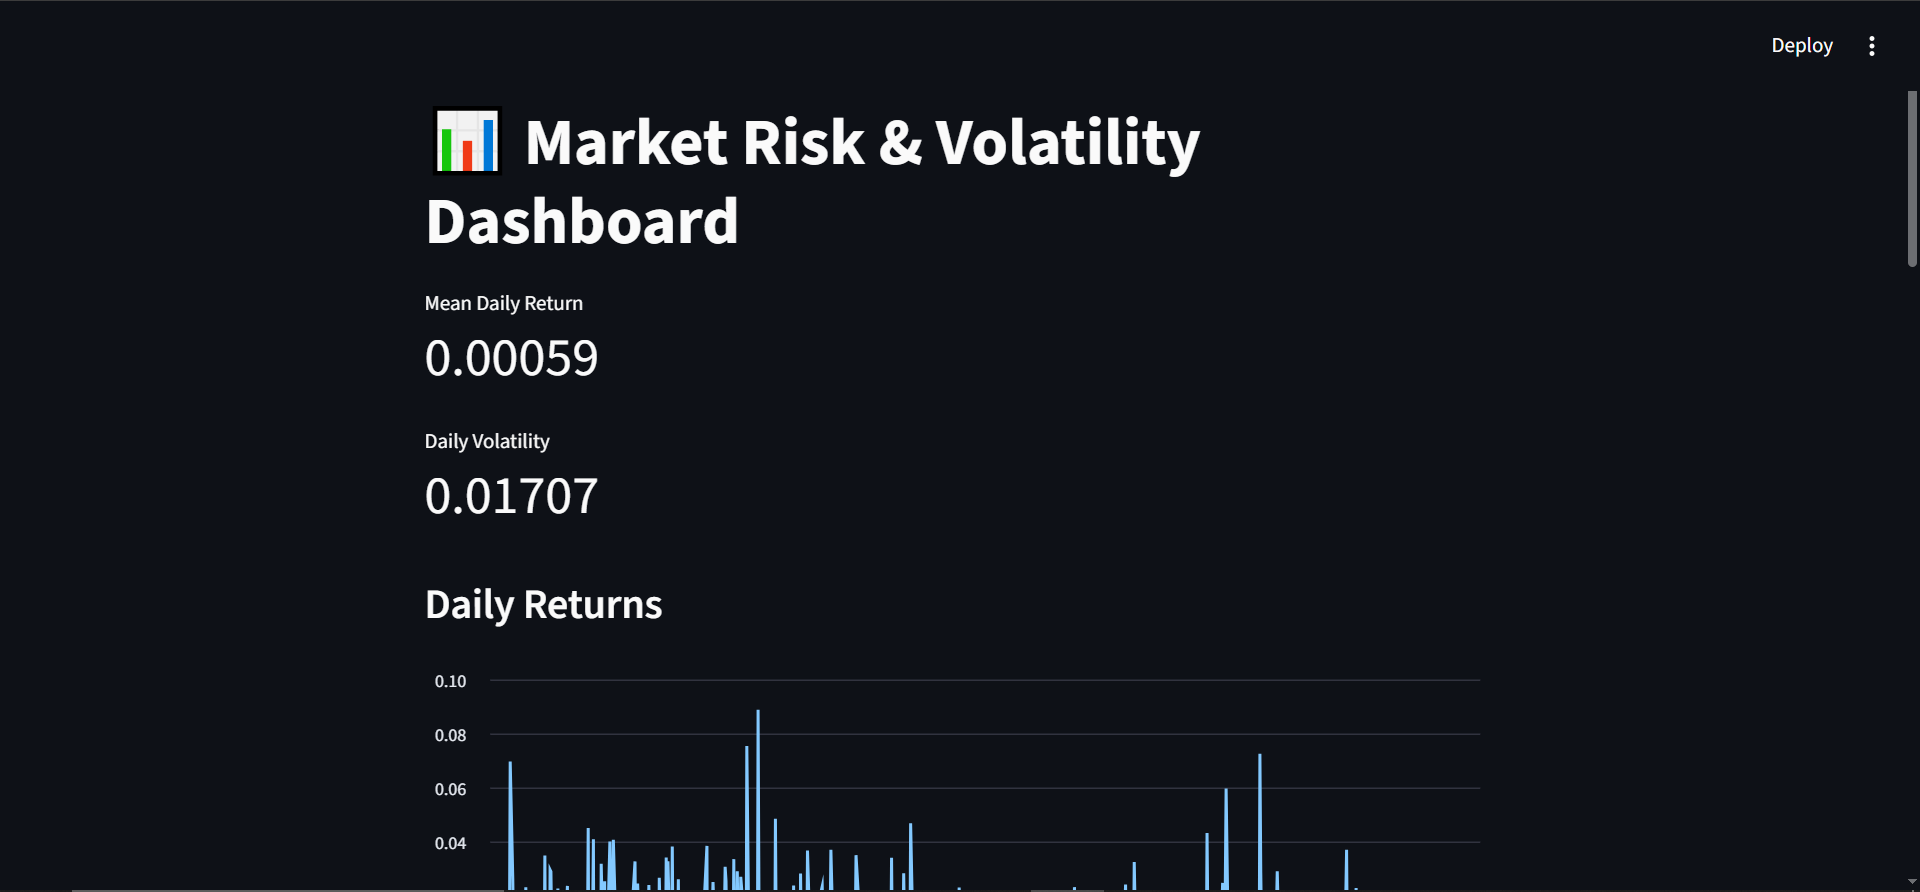
A data analytics project that analyzes stock market performance using historical financial data. The dashboard focuses on daily returns, market volatility, rolling volatility trends, and Monte Carlo simulations to evaluate risk and forecast possible future stock price movements.
Problem Statement
Financial markets are highly volatile, making it difficult for investors and analysts to
understand market risk and predict future stock behavior.
The goal of this project is to:
- Analyze stock return patterns
- Measure market volatility
- Identify risk trends over time
- Simulate future stock prices using probabilistic forecasting methods
Approach (Short)
- Collected historical stock market data using financial APIs.
- Cleaned and preprocessed the dataset for time-series analysis.
- Calculated daily returns and volatility metrics to measure market fluctuations.
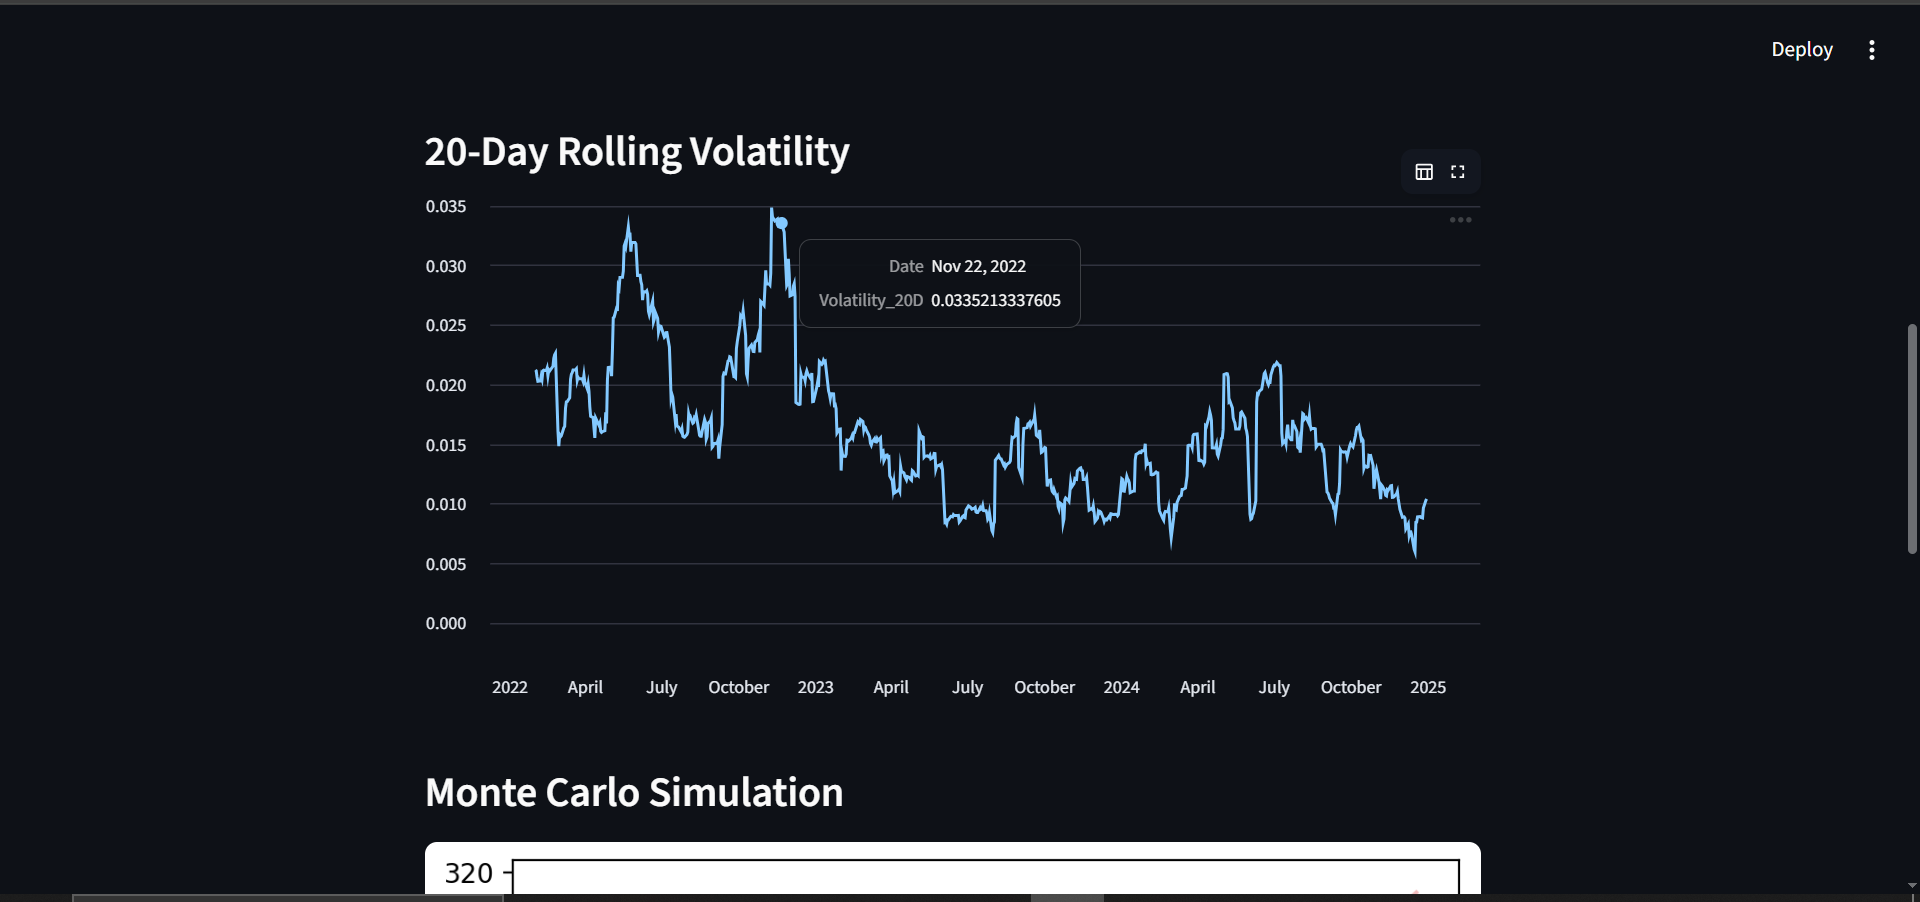
- Performed rolling volatility analysis to identify risk trends over time.
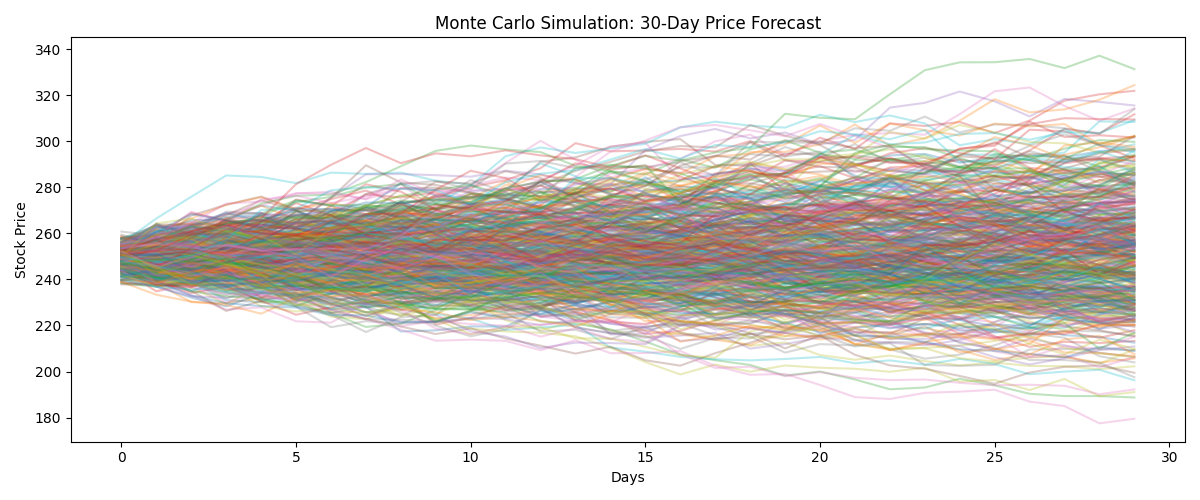
- Applied Monte Carlo Simulation to forecast multiple possible future stock price movements.
- Visualized insights through interactive charts and dashboards for better financial analysis.
Concepts & Skills Applied
Financial Data Analysis
Time Series Analysis
Risk Analysis
Volatility Measurement
Monte Carlo Simulation
Interactive Dashboard
Probability & Forecasting
Key Insights
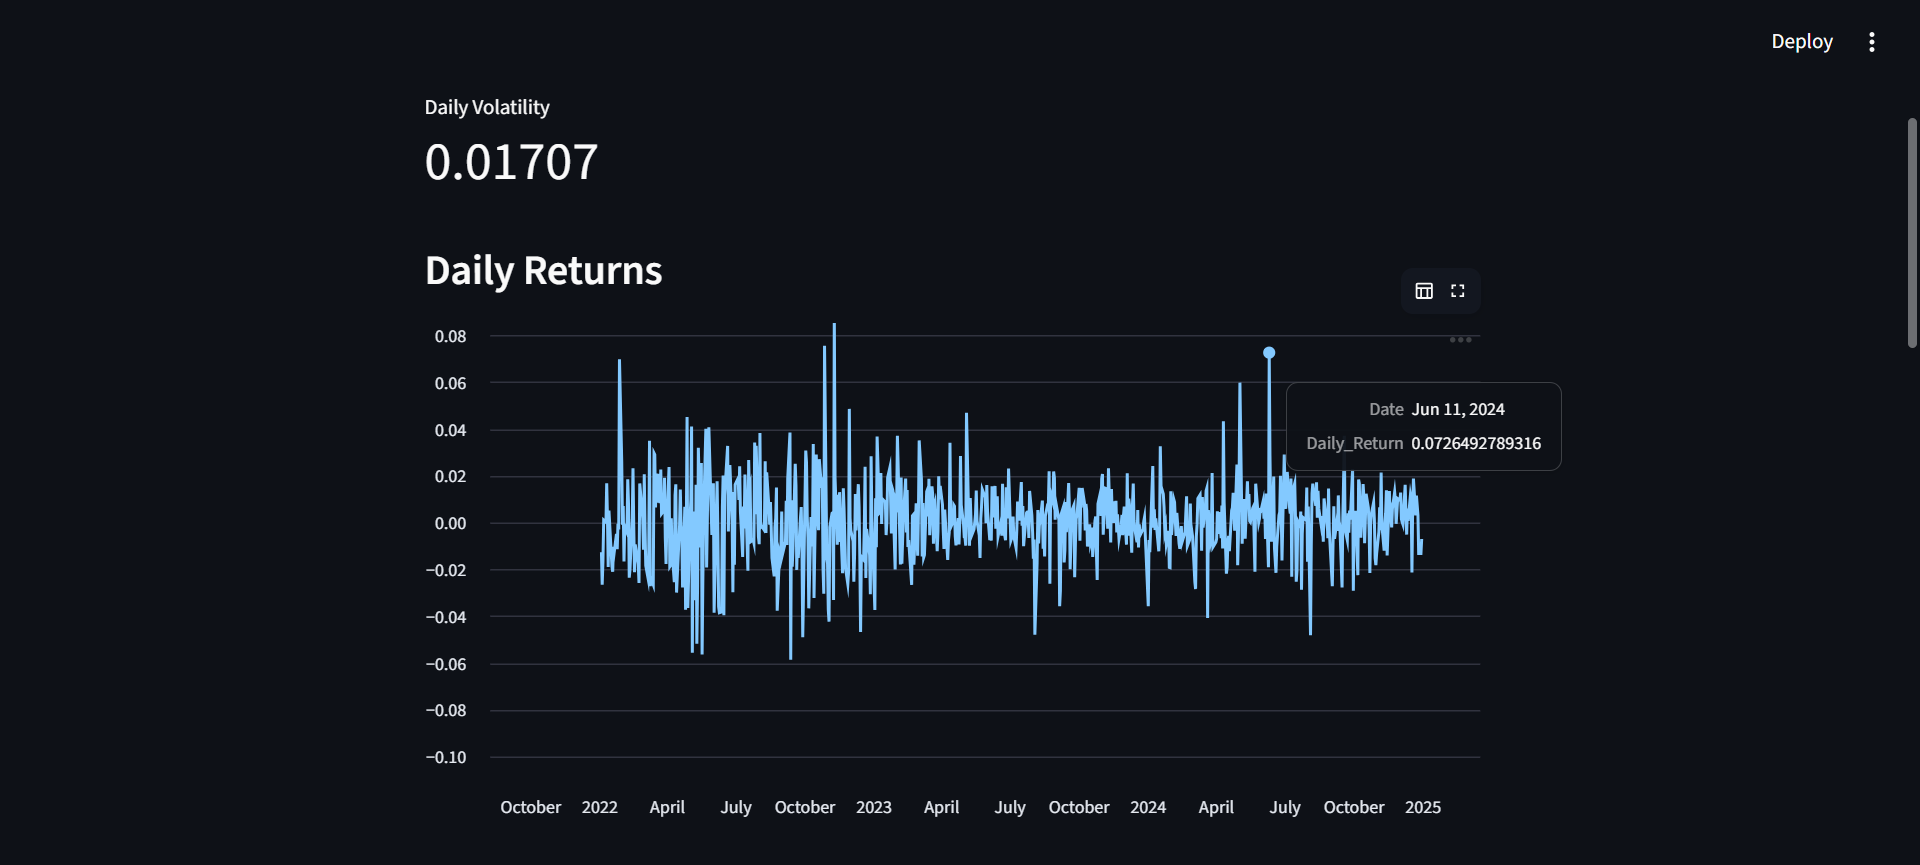
- Daily returns fluctuate frequently, showing continuous market uncertainty.
- Certain periods experienced higher volatility spikes, indicating increased investment risk.
- Rolling volatility decreased in some phases, suggesting temporary market stability.
- Monte Carlo simulations showed multiple future price possibilities rather than a single fixed prediction.
- The stock demonstrates moderate volatility overall, meaning both growth opportunities and risk exist.
Business Recommendations & Impact
Recommendations
- Investors should monitor volatility before making short-term trading decisions.
- During high-volatility periods, risk management strategies should be strengthened.
- Monte Carlo forecasting can help investors estimate potential future outcomes before investing.
- Long-term investment strategies may reduce the impact of short-term market fluctuations.
Business Impact
- Helps investors make data-driven decisions
- Supports portfolio risk assessment
- Improves understanding of market behavior
- Assists in financial forecasting and investment planning
Features
- Interactive financial dashboard
- Daily return analysis
- Volatility tracking
- Rolling volatility calculation
- Monte Carlo future price simulation
- Time-series visualizations
- Risk forecasting analytics