SaaS Product Analytics and Churn Analysis
Built an end-to-end SaaS analytics system to analyze customer behavior, identify churn drivers, and generate actionable business insights. Developed interactive dashboards and a customer health scoring model to improve retention strategies and decision-making.
Project Walkthrough
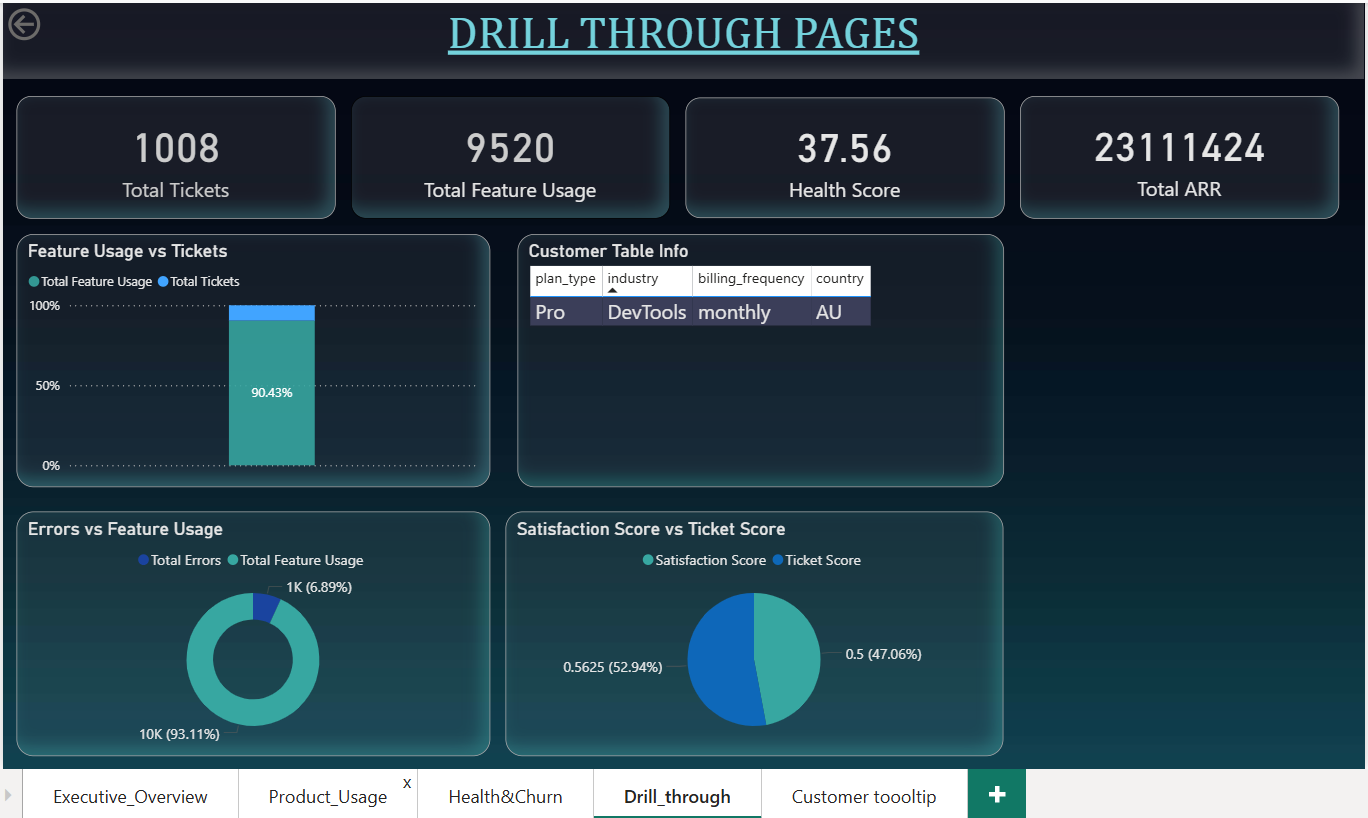
A short demonstration showcasing the interactivity, automated refresh schedules, and real-time drill-down capabilities of the final dashboard.
Video Coming Soon
The detailed video walkthrough for this project is currently in production.
Problem Statement
SaaS companies face high churn and low engagement due to lack of insights into customer behavior, product usage patterns, and the impact of support and errors on retention.
Approach & Methodology
- Collected and integrated multi-source SaaS datasets (Accounts, Subscriptions, Usage, Support, Churn)
- Performed data cleaning (handled missing values, standardized formats, converted date fields)
- Merged datasets using
account_idto create a unified master dataset (~147K rows) - Conducted feature engineering to transform event-level data into customer-level insights (usage, errors, tickets, ARR, MRR, satisfaction)
- Performed EDA and SQL-based analysis to identify churn patterns and customer segments
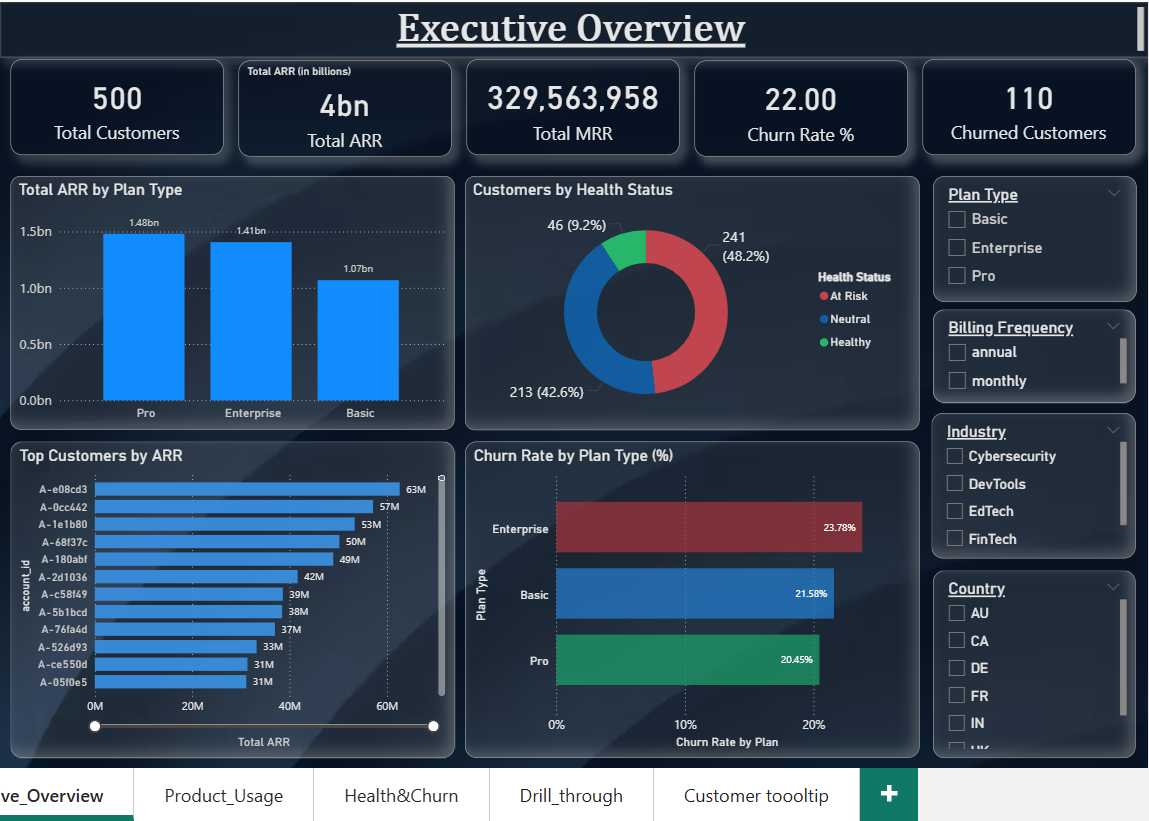
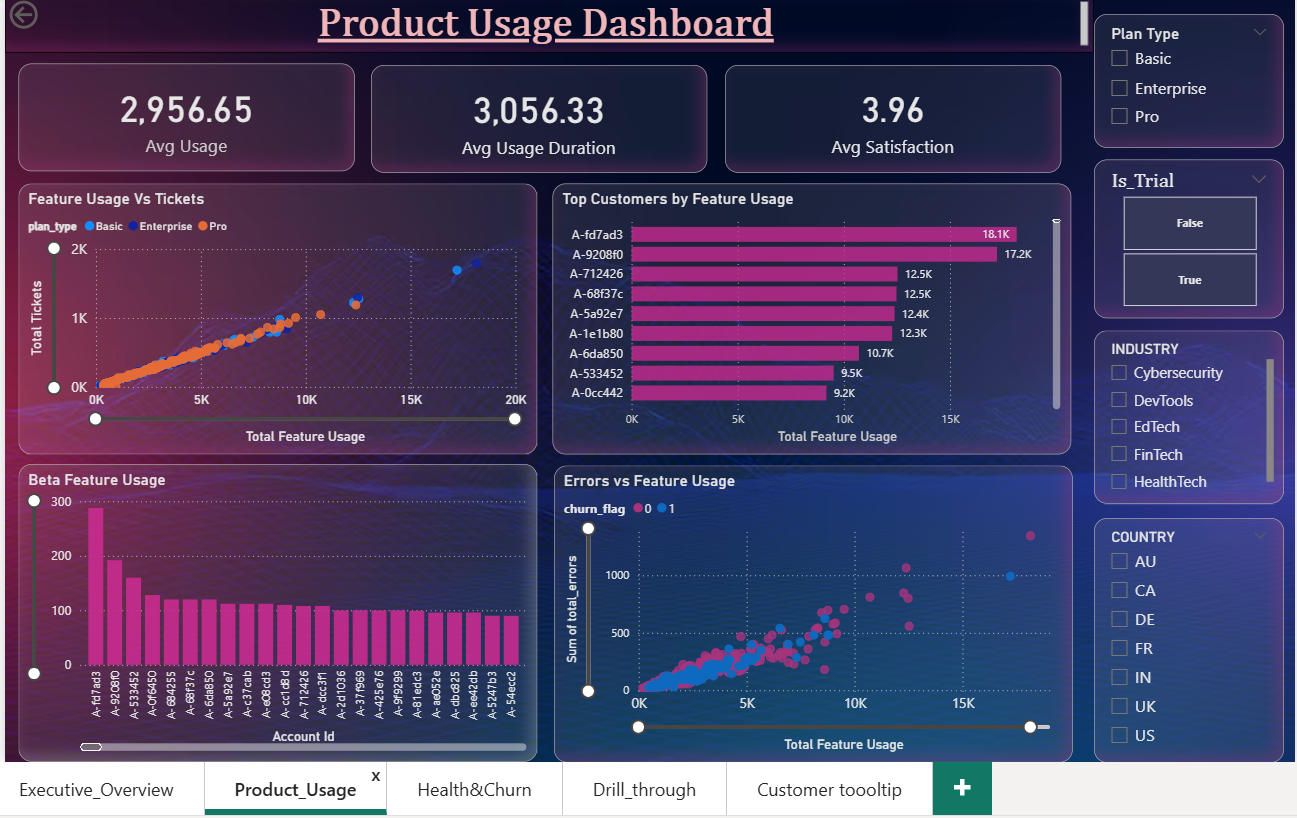
- Built interactive dashboards in Power BI for executive, product usage, and customer health insights
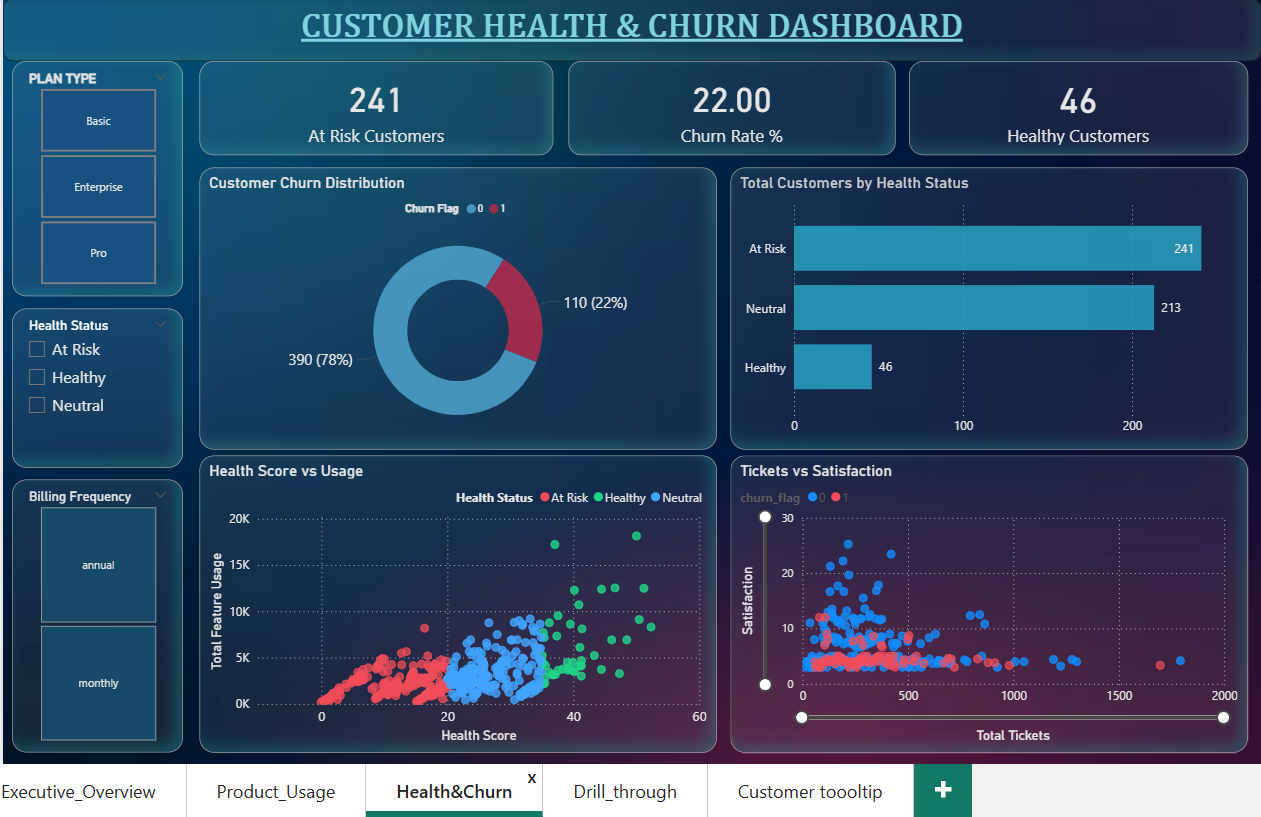
- Developed a Customer Health Scoring system to classify users (Healthy, Neutral, At Risk)
Concepts & Skills Applied
Python (Pandas, NumPy)
Matplotlib Visualization
DAX Calculations
Dashboard Design using PowerBI
KPI Analysis
Product Analysis
Storytelling with Data
Feature Engineering
Key Insights
- High churn rate (~22%): It indicates a major retention challenge and need for proactive customer strategie
- Low product engagement: It is the strongest churn driver, with most users falling in the low usage range.
- Higher error rates negatively impact retention: Highlighting product stability issues
- Customer support experience directly affects satisfaction: With more tickets often linked to lower satisfaction
- Silent churn risk identified: Some users show low engagement and satisfaction without raising support tickets
- Majority of customers fall into “At Risk” category: Indicating urgency for targeted interventions
Business Recommendations & Impact
- Improve onboarding strategies to boost early-stage user engagement and reduce initial churn
- Enhance product stability by reducing error rates and improving system performance
- Strengthen customer support quality and response time to improve satisfaction levels
- Focus retention strategies on high-value customers (Pro & Enterprise plans)
- Leverage customer health scoring to proactively identify and engage “At Risk” users
- Use data-driven dashboards to enable faster, insight-based decision-making across teams
Advance Features